The Keltner Channel is a simple yet powerful trading indicator that can help you better identify entry points, increase the profitability of your trade, and can be used to predict market reversals. In today’s article, we will analyze all the nuances and peculiarities of trading using this indicator.
What is the Keltner Channel indicator?
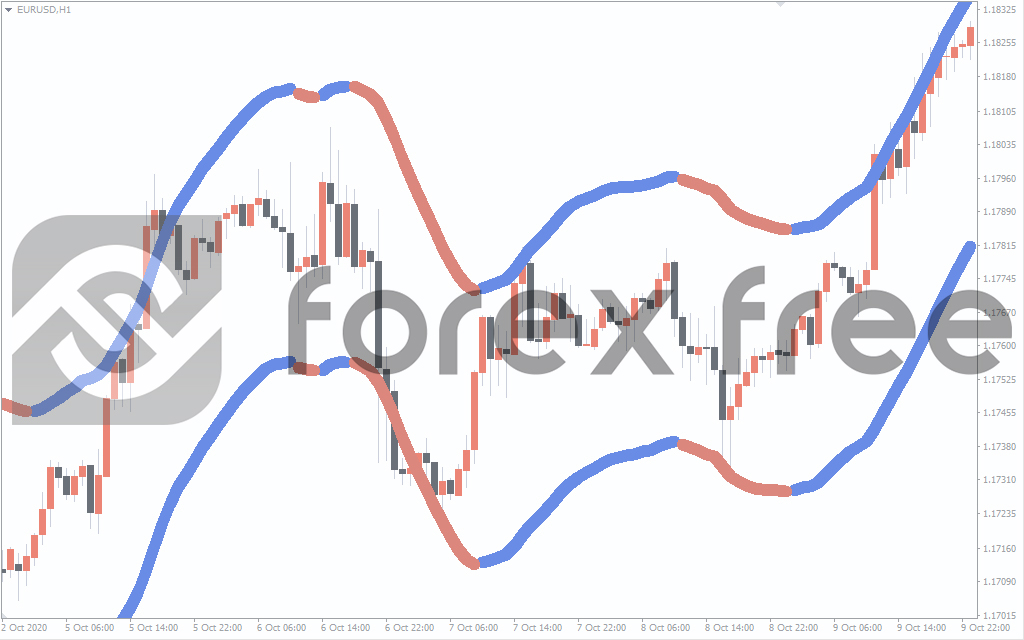
The channel based indicator (which is similar to Bollinger Bands, Donchian Channel, etc.). This means that it has upper and lower bounds that help us identify potential overbought and oversold levels.
Charles Keltner first described the indicator in 1960 in his book How to Make Money in Commodity Markets. The first version of the channel used a special modification of the moving average. In 1960, Linda Raschke modified the indicator, which now uses the ATR indicator to determine the channel width. Further, trader Robert Colby suggested using an indicator with an exponential moving average. It is this version of the indicator that we will consider.
The difference between the Keltner Channel and the Bollinger Band indicator lies in how the channel lines are calculated. The Keltner channel uses the Average True Range, and the Bollinger bands use the standard deviation. If you compare them, you will realize that the Keltner Channel shows smoother lines than the Bollinger Bands.
How to use the indicator?
You shouldn’t go short just because the price is on the upper channel. Because in a strong uptrend, the price can remain overbought for a long period. The opposite is true for a downtrend.
The price usually changes its direction when it reaches extreme values ??in the market structure. For example, the price reaches support or resistance levels.
We need to find a price that is far beyond the Keltner Channel. This suggests that the market is at an extreme level – as far as possible from its average value.
However, do not rush to open a long position here. As we already know, in a strong downtrend, the price can stay near the channel’s lower border for an extended period.
Keltner Channel trading strategy
After you learn well about the indicator, now is the turn to find a trading strategy based on the Keltner Channels indicator.
Buy setup
- Let the price approach the support level.
- Wait for the compression of the Keltner channel (the price is squeezed between the outer and middle lines of the channel).
- Open a position on the breakout.
- Place stop-loss below the lower band of the channel.
- Place take profit near the next resistance level on the chart.
Sell setup
- Let the price approach the resistance level.
- Wait for the compression of the Keltner channel (the price is squeezed between the outer and middle lines of the channel).
- Open a position on the breakout.
- Place stop-loss above the upper band of the channel.
- Place take profit near the next support level on the chart.
Conclusion for Keltner Channel indicator
The Keltner Channel is a channel indicator similar to the Bollinger Bands with the upper, middle, and lower channel lines, but the way they are calculated is different. The market changes direction when the price closes outside the outer channel line and enters the key market structure (support and resistance levels). If the price closes outside the outer channel line in a strong trend, avoid bounce trading. The Keltner Channel Squeeze occurs when the price is between the 20 MA and the outer channel line. This signals an imminent price breakout.


Valoraciones
No hay valoraciones aún.